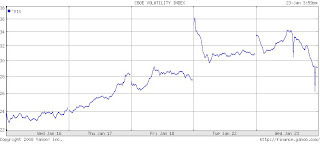
There is a strong correlation between market volatility and a bear market, and with the nail-bitting whiplash that Wall Street has been experiencing lately, this relationship has become more apparent.
The VIX, or the CBOE Volatility Index, is the common measure of market fickleness. Since Tuesday, the VIX has redeemed its more appropriate moniker, the "fear index." The Dow fell more than 2% midday today, but then surged nearly 300 points (2.5%), causing the VIX to reach a high of 34.42. Even worse, when the markets opened on Tuesday following a worldwide plummet , the index spiked 37.57 before closing at 31.01
What does this all mean? Well, we haven't seen such a jump in the VIX since the last bear market in 2002. Simply put, when the index consistently breaks the 35 mark, then it's a hint that the bear is here and we have reached a market bottom. From what we've seen in the past two days of trading, it's well on its way.
Wednesday, January 23, 2008
Subscribe to:
Post Comments (Atom)


4 comments:
Do you really think we've reached a market bottom? To me the fact that the VIX has consistently broken the 35 mark doesn't indicate this. It seems that such volatility (in volatility itself) would mean a hugely uncertain market. If you look at the 6 month chart, it seems as though the VIX has been going in a cyclical pattern, as the S&P itself, of relative stability during October and late December, back to previous levels of volatility/uncertainty.
Quite the contrary, a relatively flat or sharply declining VIX would seem to indicate that we've reached a bottom. Am I missing something?
Let me explain this more clearly.
The VIX is defined by various ratios of puts and calls that measure complacency or panic in the market. To be absolutely certain, any reading above 40 would indicate a pure panic in the market, but we have not reached such levels since 2002. A high VIX reading suggests that there is a freak sell-off that is usually accompanied by a market bottom.
If you look at the 6 month chart and compare it to the S&P, you will find clear evidence that when the VIX had been on the rise, the S&P was in the red. And the inverse is true. If you examine when the VIX was lowest this past six months, which was in October, you will find S&P at the opposite; in fact, the S&P reached a record high within that period.
I disagree with your last comment; a "relatively flat or sharply declining VIX would [...] indicate a market bottom," and I would add, over an extensive period of time. Quite the contrary, I would say that would indicate that we are on our way to a market recovery. The VIX and the market have an inverse relationship, not a proportional relationship that you have suggested. Especially in this market with many institutional investors and after you incorporate contrarian and mass psychology, waiting for the VIX to fall and concluding that as a market bottom would put you far too behind to act.
If you need further reference, Jim Cramer explains this correlation between the VIX and the market in his book Real Money.
http://www.thestreet.com/s/watch-the-volatility-index-for-mutual-fund-plays/funds/mutualfundinvesting/10400134.html?puc=_tscfoc
good article on the vix. biggest take away:"Because the VIX is composed of put as well as call options, it will rise when fear grips the market and worried investors rush into puts as insurance against severe downturns. Extremely pessimistic periods, when accumulation of puts results in sharp rises in the VIX, often mark points of capitulation when pessimism reaches an apogee and the market frequently turns higher because everyone with an inclination to sell has already done so. "
Markets have thir ups and downs.
Post a Comment